Introduction
Over a few long, cold winter weekends, I spent some time exploring the concept of serverless Python application architecture in AWS. After learning more about the AWS technologies that drive a serverless application architecture, I began to envision how they could be applied in a manner similar to how many organizations use Hadoop and other big data stacks to drive their threat detection capabilities.
In this multipart series, I will walk through my effort to prototype a serverless detection platform using various AWS services. More importantly, I will demonstrate how these services can be used to address real-life detection use cases.
In Part One, I’ll focus on a very simple endpoint detection use case: detecting the use of PowerShell execution with an encoded command in near real-time. In most environments, there’s no legitimate reason to use the -Encoded switch for running PowerShell commands. This is a technique seen employed by many phishing campaigns and is commonly used to drop and run malicious payloads.
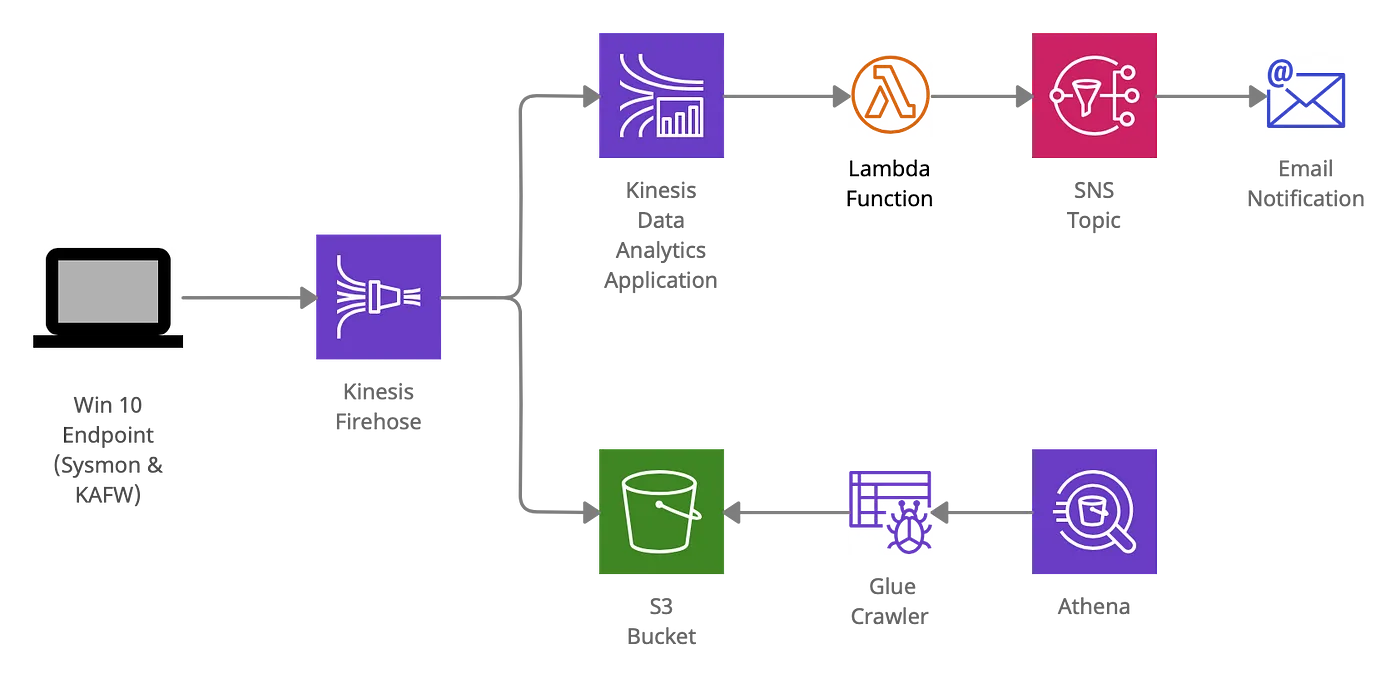
Architecture Diagram

Log Streaming & Storage
To start, I created a basic AWS S3 bucket with the default configuration settings to act as a storage repository for endpoint security logs. To handle streaming data from my endpoint to the S3 bucket, I created a Kinesis Firehose delivery stream. I configured it as a “Direct PUT or other sources” source to consume the events and set up the destination as the S3 bucket I created above. I provisioned permissions by creating a custom policy named “firehose-s3-access-policy” and assigning it to the Kinesis role “firehose-s3-access-role” that grants access to write data (PutLogEvents) to the S3 bucket:
{
    "Version": "2012-10-17",
    "Statement":
    [
        {
            "Effect": "Allow",
            "Action": [
                "s3:AbortMultipartUpload",
                "s3:GetBucketLocation",
                "s3:GetObject",
                "s3:ListBucket",
                "s3:ListBucketMultipartUploads",
                "s3:PutObject"
            ],
            "Resource": [
                "arn:aws:s3:::bucket-name",
                "arn:aws:s3:::bucket-name/*"
            ]
        },
        {
           "Effect": "Allow",
           "Action": [
               "logs:PutLogEvents"
           ],
           "Resource": [
               "arn:aws:logs:region:account-id:log-group:firehose-error-log-group:log-stream:firehose-error-log-stream"
           ]
        }
    ]
}
I created a separate policy named “log-delivery-stream-access-policy” which granted access to the Kinesis Firehose delivery stream:
{
    "Version": "2012-10-17",
    "Statement": [
        {
            "Sid": "VisualEditor1",
            "Effect": "Allow",
            "Action": [
                "firehose:PutRecord",
                "firehose:PutRecordBatch"
            ],
            "Resource": "arn:aws:firehose:region:account-id:deliverystream/log-delivery-stream"
        }
    ]
}
Lastly, I created an IAM user with programmatic access and attached it to the “log-delivery-stream-access-policy” policy. I used this account’s credentials to authenticate and authorize the endpoint agent to send logs to the Firehose stream, which in turn, will dump logs into the S3 bucket.
Endpoint Agent
On my Windows 10 virtual machine, I installed three main components to detect the use of encoded PowerShell commands and to deliver logs to AWS:
- Sysmon — for logging process creation to Windows Event logs.
- AWS Kinesis Agent for Windows — to forward Sysmon Windows Event logs to AWS.
- AWS CLI — to configure an authentication profile for use by Kinesis Agent for Windows.
I downloaded Sysmon from Microsoft and installed it as an Administrator, using the default configuration settings. Sysmon EventId 1 (process creation) and EventId 5 (process termination) are logged by default which fit the needs for this use case.
Next, I installed the AWS CLI using the instructions from AWS. This was required to create a profile that authenticates the AWS Kinesis Agent to my AWS account using the IAM account I provisioned and attached to the “log-delivery-stream-access-policy” policy. After installing the AWS CLI, I ran aws configure --profile security-logging and entered the login information for the IAM user to setup an authentication profile named "security-logging".
I installed the AWS Kinesis Agent for Windows as described in AWS’s instructions. Kinesis Agent for Windows is capable of ingesting Windows Event logs and transmitting them to AWS in structured JSON format.
I configured Kinesis Agent for Windows by modifying the “appsettings.json” file located in “C:\Program Files\Amazon\AWSKinesisTap”. This configuration file is used to specify the following:
- The authentication profile (security-logging)
- The Sysmon event location (WindowsEvents/Sysmon)
- The Kinesis data stream where the logs are sent (security-log-delivery-stream)
- The association between the data source (Sysmon) and where they should be sent (Kinesis Firehose)
{
  "Sources": [
    {
      "Id": "Sysmon",
      "SourceType": "WindowsEventLogSource",
      "LogName": "Microsoft-Windows-Sysmon/Operational"
    }
  ],
  "Sinks": [
    {
      "Id": "FirehoseLogStream",
      "SinkType": "KinesisFirehose",
      "StreamName": "security-log-delivery-stream",
      "Region": "us-east-2",
      "Format": "json",
      "ObjectDecoration": "ComputerName={ComputerName};DT={timestamp:yyyy-MM-dd HH:mm:ss}",
      "ProfileName": "security-logging"
    }
  ],
  "Pipes": [
    {
      "Id": "JsonLogSourceToFirehoseLogStream",
      "SourceRef": "Sysmon",
      "SinkRef": "FirehoseLogStream"
    }
  ],
  "SelfUpdate": 0,
  "Telemetrics": { "off": "true" }
}
Note: for the service to use the AWS “security-logging” profile, I configured the Kinesis Agent for Windows service to run as the Windows user account (instead of the default built-in system account) I used to setup the AWS CLI “security-logging” profile. In a production network, AWS recommends managing the host and an associated role using AWS Systems Manager to authenticate on-premise (non-EC2) assets. In this recommended configuration, AWS manages the credential and removes the need for the API-only user account and running the service under a specific Windows user.
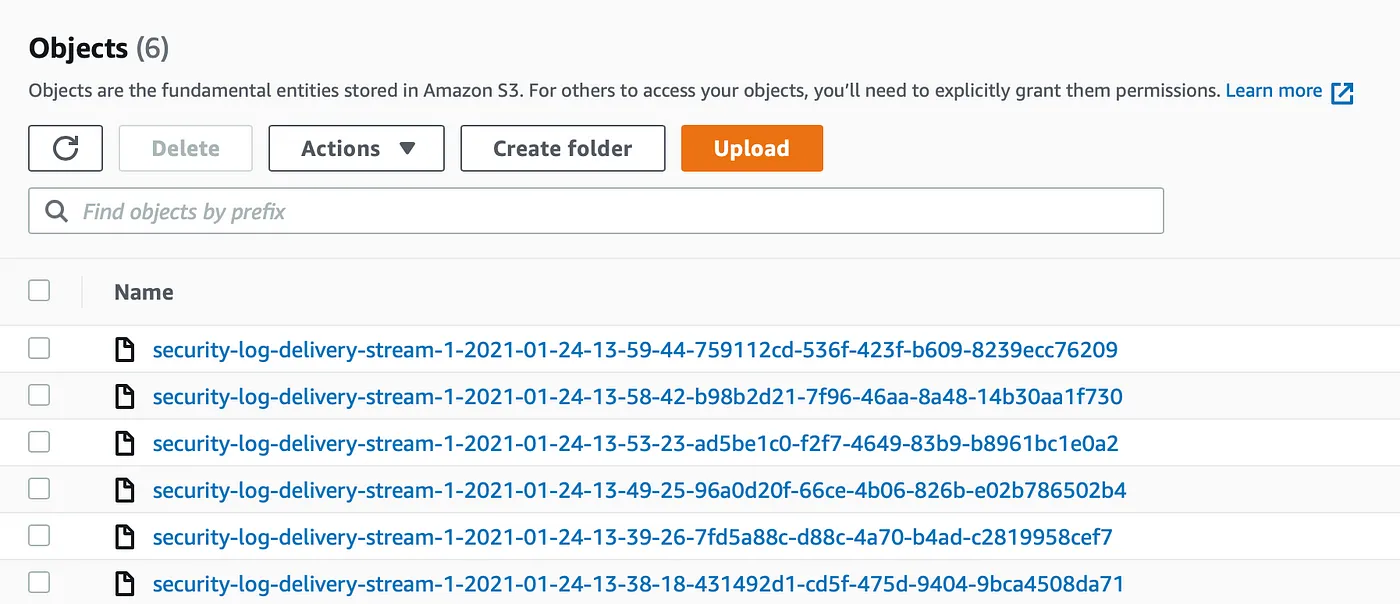
After I reconfigured and restarted the Kinesis Agent for Windows service the logs began flowing into the S3 bucket:

Data Analysis
In their raw state, I couldn’t easily consume the Sysmon events for analysis from the S3 bucket. Kinesis Firehose loads many JSON files in a large hierarchy of folders based on date and time. To address this problem, I used AWS Glue and Athena.
AWS Glue is an extract, transform, load (ETL) service used to prepare and load data for more in depth analysis using tools like AWS Athena. In this case, I used a basic Glue configuration to create metadata tables for the Sysmon event data in S3. The setup was fairly simple: I created a Glue database called “sysmon-logs” and created a table for the event metadata using a Glue crawler. I named the crawler “sysmon-crawler”, configured it to crawl new folders in the S3 bucket, and created a new IAM role that granted the appropriate permissions. To save costs, I opted to run the crawler on demand instead of on a scheduled basis. Finally, I configured the crawler to write the table to the new “sysmon-logs” database and manually ran the crawler.
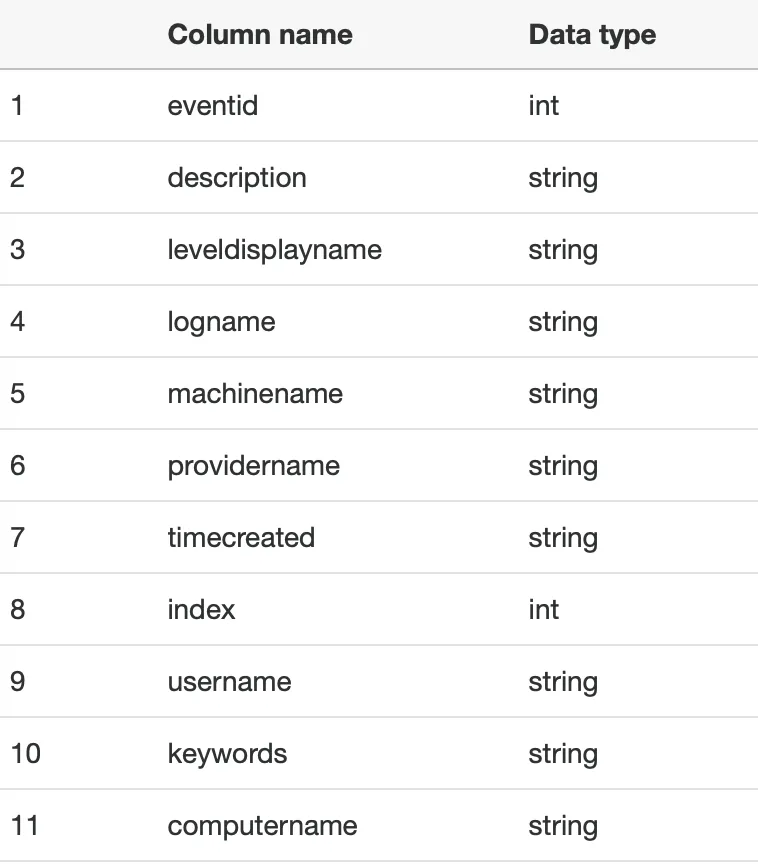
The table in the “sysmon-logs” Glue database was now populated with metadata based on the JSON logs files in S3:

I opened Athena and began exploring the Sysmon events. I wrote a simple SQL query to return the first 10 records from the “sysmon-logs” database and metadata table:
SELECT *
FROM "sysmon-logs"."2021"
WHERE eventid=1 ORDER BY timecreated DESC LIMIT 10;
The above query returned a nicely organized table of Sysmon EventId 1 “ProcessCreate”events. On my Windows 10 workstation, I simulated an encoded PowerShell command by running Powershell.exe -encode "RwBlAHQALQBDAG8AbQBtAGEAbgBkAA==", which in turn runs the Get-Command PowerShell cmdlet.
Shortly after, I manually reran the Glue crawler to gather the new Sysmon log events. Switching back to Athena, I rewrote the SQL query to return the Sysmon event in which I ran the encoded PowerShell command:

SELECT *
FROM "sysmon-logs"."2021"
WHERE eventid=1
        AND description LIKE '%-encode%'
        AND description LIKE '%powershell.exe%'
In just a few seconds, Athena returned the log entry that shows me running the encoded PowerShell command:
Detection Content
I could have used Athena to detect the use of encoded PowerShell commands by scheduling batch jobs, but this would not have accomplished the requirement to detect it in near real-time. Instead, I turned to a Kinesis Analytic Application which is capable of analyzing the data stream in real-time.
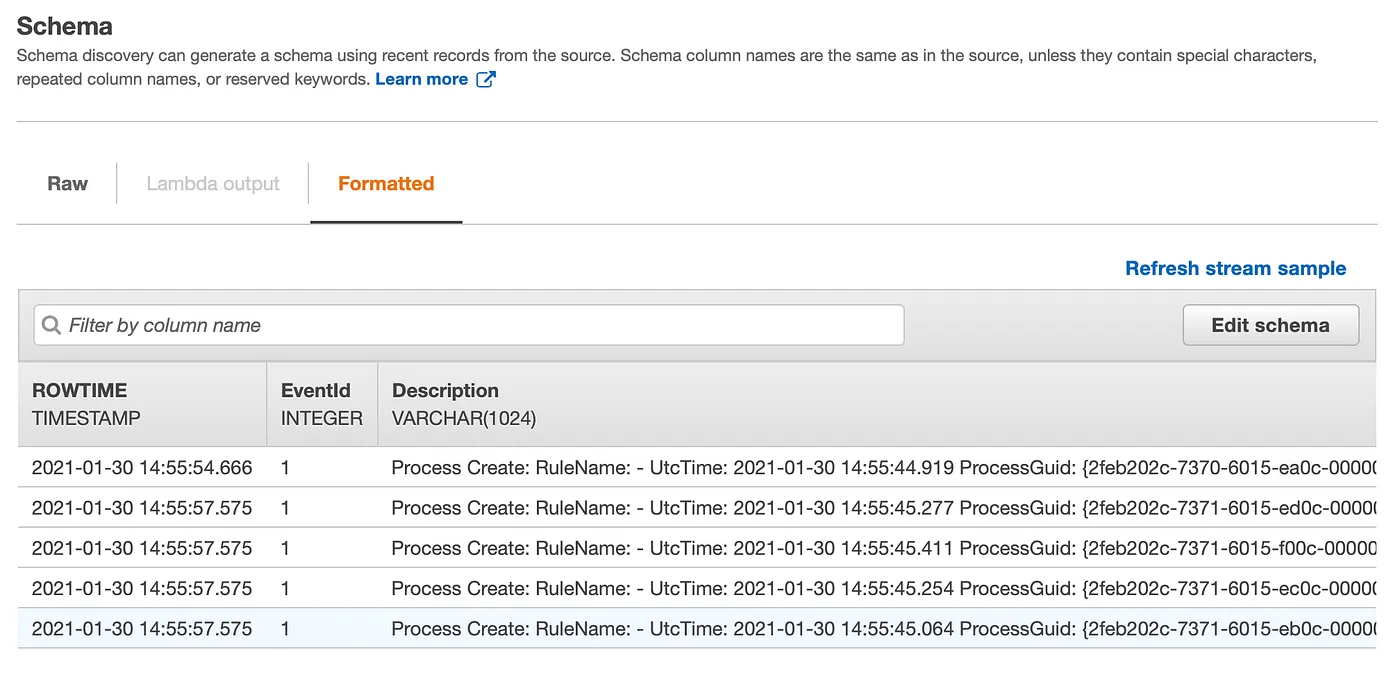
I created an Kinesis Data Analytics Application named “SecurityAlert” using the SQL runtime. I connected the application as a consumer of the Kinesis Firehose security log delivery steam and let the application automatically determine the schema of the stream’s data:

The In-Application name of the streaming data was “SOURCE_SQL_STREAM_001”:

To perform the real-time analytics, I setup a SQL statement using the AWS SQL template “Simple Alert” and changed the fields to match the schema defined fo the Sysmon events. I chose to include only the “description” and “host” fields in the resulting “SECURITY_ALERT_SQL_STREAM” stream:
CREATE OR REPLACE STREAM "SECURITY_ALERT_SQL_STREAM"
           (description VARCHAR(1024),
           host VARCHAR(50));

CREATE OR REPLACE PUMP "STREAM_PUMP" AS
   INSERT INTO "SECURITY_ALERT_SQL_STREAM"
      SELECT STREAM "Description", "MachineName"
      FROM   "SOURCE_SQL_STREAM_001"
      WHERE  "Description" LIKE '%encode%'
      AND "Description" LIKE '%PowerShell%';
I saved the SQL statement and reran the simulated encoded PowerShell command. The result quickly populated the in the “SECURITY_ALERT_SQL_STREAM” real-time analytics window:

I created a Lambda function to consume and send results of the “SECURITY_ALERT_SQL_STREAM” to an AWS Simple Notification Services (SNS) topic. Once again, AWS provided a handy Lambda blueprint (template) named “Kinesis Data Analytics Output to SNS (Python 2.7)” that I tweaked to handle events sourcing from the new stream.
For each event delivered to the Lambda function, the Python script decodes the event data, loads it into a JSON object, creates the message subject and body, and publishes the message to an SNS topic:
from __future__ import print_function
import boto3
import base64
import json

client = boto3.client('sns')
topic_arn = 'arn:aws:sns:region:accountid:security-alert-sns'


def lambda_handler(event, context):
    output = []
    success = 0
    failure = 0
    for record in event['records']:
        try:
            payload = base64.b64decode(record['data'])
            jpayload = json.loads(payload)
            message_body = "PowerShell encoded command detected on " + jpayload['HOST']
            client.publish(TopicArn=topic_arn, Message=message_body, Subject='New Security Alert')
            output.append({'recordId': record['recordId'], 'result': 'Ok'})
            success += 1
        except Exception:
            output.append({'recordId': record['recordId'], 'result': 'DeliveryFailed'})
            failure += 1

    print('Successfully delivered {0} records, failed to deliver {1} records'.format(success, failure))
    return {'records': output}
Heads up: Running a Kinesis Analytic Application quickly accumulates AWS costs. The minimal cost for a Kinesis Analytics application running full-time is ~ $75 USD a month. If you’re following along, make sure to stop the service when you are finished testing.
Alert Delivery
I created a “standard” type Simple Notification Services (SNS) topic to create and send an email alert based new messages published by the Lambda function. I configured an email subscription and set the endpoint to my personal email address.
I configured and assigned a policy “AWSLambdaSNSSecurityAlert” to the Lambda function which granted it permission to publish messages to the SNS topic:
I ran one final simulation of the encoded PowerShell command and within seconds, an email arrived in my Inbox:

Conclusion
I was thrilled when an email arrived in my Inbox almost instantaneously after running an encoded PowerShell command on my Windows 10 endpoint, but I’ve barely scratched the surface with this one simple use case. With some foundational knowledge of AWS’s serverless services, the potential to build out various components of a detection platform is almost limitless. In reality, this same architecture could be expanded to provide functionality similar to many commercial EDRs. In my future posts, I hope to expand upon this basic architecture by including features like field expansion, data enrichment, and some machine learning driven content. Thanks for the read!